

Providence is Ranked as One of the Worst Cities for Thanksgiving Travel
GoLocalProv News Team
Providence is Ranked as One of the Worst Cities for Thanksgiving Travel
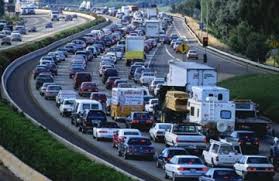
Google used anonymous traffic data from Android devices to come up with the rankings and other helpful tips about holiday travel. Los Angeles, California, was ranked as the worst city for holiday travel, joined in the top three by Washington, D.C., and San Francisco California.
Google also found that for most people, traveling on Tuesday could help save some time and frustration. Wednesday was ranked as the worst travel day for any city, except for Boston, who’s worst day is Tuesday, and Honolulu, Hawaii, Providence, and San Francisco, who’s worst day is Saturday.
GET THE LATEST BREAKING NEWS HERE -- SIGN UP FOR GOLOCAL FREE DAILY EBLASTAccording to AAA, driving remains the most popular mode of travel for Thanksgiving. Nearly 42 million Americans will take a road trip this Thanksgiving, a small increase in the amount of road travelers in 2014. In New England, more than two million residents are among those expected to travel, 1.8 million of them by car. Another 226,000 plan to fly to their vacation destinations.
“This Thanksgiving, the greatest number of Americans since 2007 will carve out time to visit family and friends,” said Lloyd P. Albert, AAA Northeast Senior Vice President of Public and Government Affairs. “While many people remain cautious about the economy and their finances, many thankful Americans continue to put a premium on traveling to spend the holiday with loved ones.”
Air travel is also expected to increase slightly, with 3.6 million Americans traveling by plane to their holiday destination. Other modes of transportation, including cruises, trains and buses, will decrease slightly this year.
The Communities with the Greatest Racial Disparities in Traffic Stops

#37 Barrington
# of Stops: 7,634
% Non-White Stops: 7.8%
% Non-White Driving Population: 14.5%
Disparity: -6.7%

#36 West Greenwich
# of Stops: 1,376
% Non-White Stops: 5.2%
% Non-White Driving Population: 8.0%
Disparity: -2.8%

#35 Westerly
# of Stops: 5,304
% Non-White Stops: 8.9%
% Non-White Driving Population: 11.5%
Disparity: -2.6%

#34 Central Falls
# of Stops: 3,793
% Non-White Stops: 62.5%
% Non-White Driving Population: 64.8%
Disparity: -2.3%

#33 Bristol
# of Stops: 5,439
% Non-White Stops: 7.5%
% Non-White Driving Population: 7.7%
Disparity: -0.2%

#32 Coventry
# of Stops: 7,520
% Non-White Stops: 4.8%
% Non-White Driving Population: 5.0%
Disparity: -0.2%

#31 North Kingstown
# of Stops: 8,819
% Non-White Stops: 10.1%
% Non-White Driving Population: 10.3%
Disparity: -0.2%

#30 Warwick
# of Stops: 20,707
% Non-White Stops: 13.8%
% Non-White Driving Population: 13.9%
Disparity: -0.1%

#29 Burrillville
# of Stops: 2,628
% Non-White Stops: 4.6%
% Non-White Driving Population: 4.4%
Disparity: 0.2%

#28 East Greenwich
# of Stops: 4,738
% Non-White Stops: 9.9%
% Non-White Driving Population: 9.4%
Disparity: 0.4%

#27 East Providence
# of Stops: 12,612
% Non-White Stops: 19.9%
% Non-White Driving Population: 18.7%
Disparity: 1.2%

#26 Tiverton
# of Stops: 942
% Non-White Stops: 6.2%
% Non-White Driving Population: 4.9%
Disparity: 1.3%

#25 South Kingstown
# of Stops: 9,233
% Non-White Stops: 11.4%
% Non-White Driving Population: 10.0%
Disparity: 1.5%

#24 Little Compton
# of Stops: 1,967
% Non-White Stops: 4.5%
% Non-White Driving Population: 2.8%
Disparity: 1.7%

#23 Richmond
# of Stops: 1,418
% Non-White Stops: 6.6%
% Non-White Driving Population: 4.7%
Disparity: 2.0%

#22 Portsmouth
# of Stops: 9,347
% Non-White Stops: 10.1%
% Non-White Driving Population: 7.9%
Disparity: 2.2%

#19 Charlestown
# of Stops: 2,518
% Non-White Stops: 7.6%
% Non-White Driving Population: 5.0%
Disparity: 2.6%

#20 Narragansett
# of Stops: 5,151
% Non-White Stops: 7.5%
% Non-White Driving Population: 4.9%
Disparity: 2.7%

#19 Newport
# of Stops: 6,266
% Non-White Stops: 17.5%
% Non-White Driving Population: 14.5%
Disparity: 3.0%

#18 Glocester
# of Stops: 3,897
% Non-White Stops: 7.1%
% Non-White Driving Population: 3.9%
Disparity: 3.1%

#17 Scituate
# of Stops: 2,376
% Non-White Stops: 7.4%
% Non-White Driving Population: 4.1%
Disparity: 3.3%

#16 Smithfield
# of Stops: 6,848
% Non-White Stops: 11.2%
% Non-White Driving Population: 7.8%
Disparity: 3.4%

#15 Jamestown
# of Stops: 3,286
% Non-White Stops: 8.0%
% Non-White Driving Population: 4.4%
Disparity: 3.6%

#14 Warren
# of Stops: 2,308
% Non-White Stops: 10.0%
% Non-White Driving Population: 5.5%
Disparity: 4.5%

#13 Middletown
# of Stops: 8,008
% Non-White Stops: 18.1%
% Non-White Driving Population: 12.4%
Disparity: 5.6%

#12 Woonsocket
# of Stops: 4,863
% Non-White Stops: 27.5%
% Non-White Driving Population: 21.6%
Disparity: 5.9%

#11 Hopkinton
# of Stops: 5,217
% Non-White Stops: 11.4%
% Non-White Driving Population: 5.5%
Disparity: 5.9%

#10 West Warwick
# of Stops: 8,954
% Non-White Stops: 10.6%
% Non-White Driving Population: 4.6%
Disparity: 6.0%

#9 Cumberland
# of Stops: 5,314
% Non-White Stops: 16.9%
% Non-White Driving Population: 10.6%
Disparity: 6.3%

#8 Foster
# of Stops: 2,323
% Non-White Stops: 12.7%
% Non-White Driving Population: 4.7%
Disparity: 8.0%

#7 Pawtucket
# of Stops: 17,779
% Non-White Stops: 42.8%
% Non-White Driving Population: 34.5%
Disparity: 8.3%

#6 Johnston
# of Stops: 8,374
% Non-White Stops: 24.9%
% Non-White Driving Population: 11.9%
Disparity: 12.9%

#5 Lincoln
# of Stops: 2,197
% Non-White Stops: 24.9%
% Non-White Driving Population: 11.4%
Disparity: 13.6%

#4 North Providence
# of Stops: 5,305
% Non-White Stops: 32.0%
% Non-White Driving Population: 16.2%
Disparity: 15.8%

#3 Cranston
# of Stops: 12,875
% Non-White Stops: 38.6%
% Non-White Driving Population: 21.4%
Disparity: 17.1%

#2 North Smithfield
# of Stops: 3,120
% Non-White Stops: 27.1%
% Non-White Driving Population: 5.5%
Disparity: 21.7%

#1 Providence
# of Stops: 18,026
% Non-White Stops: 64.0%
% Non-White Driving Population: 39.9%
Disparity: 24.1%


