

RI Has Highest Child Poverty Rate in New England at 21.5%
GoLocalProv News Team
RI Has Highest Child Poverty Rate in New England at 21.5%
This equated to 44,923 of Rhode Island’s 208,700 children under the age of 18 living below the federal poverty threshold, which was an income of $18,769 for a family of three with two children, and $23,624 for a family of four with two children in 2013.
And in 2013, an estimated 9% -- 19,262 - all children in Rhode Island lived in extreme poverty. Families with incomes below 50% of the federal poverty threshold are considered to be living in extreme poverty. In 2013, the extreme poverty level was $9,385 for a family of three with two children and $11,812 for a family of four with two children.
GET THE LATEST BREAKING NEWS HERE -- SIGN UP FOR GOLOCAL FREE DAILY EBLAST"Our report shows that nearly half of the kids who are living in poverty are living in extreme poverty," said Elizabeth Burke Bryant, RI Kids Count Executive Director. "We need to look at all kids in poverty, but especially look at those in extreme poverty - those are where resources are most immediately needed."
Data at a Glance
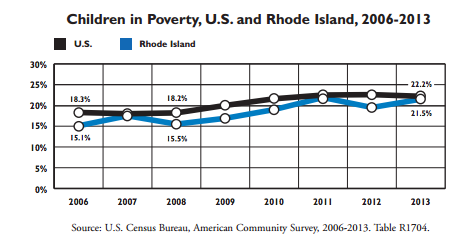
Rhode Island’s child poverty rates rose from 15.5% in 2008 to 21.5% in 2013, while the U.S. rates increased from 18.2% to 22.2% during that same time period. Kids Count reported, "The effects of the recession, which was the longest on record since World War II, persisted well past the official end of the recession and are only just beginning to decline at the national level."
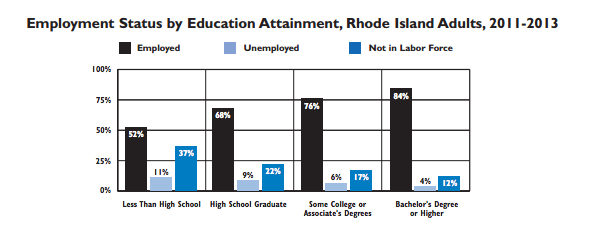
"Childhood poverty rates are tied to employment rates and good jobs," said Bryant. "It's all about the income in the child's family. Now that there's some [economic] recovery, there's an urgency of having great jobs with incomes to bring families above the poverty threshold."
Bryant spoke to what she heard from Governor Gina Raimondo on the campaign trail, and what she hopes to see from the news administration.
"I think there are two things I was hearing," said Bryant. "Raimondo has a major focus on jobs and the economy. Every time she speaks, there's an urgency on more jobs, better jobs, and an improved economy. That's good to hear, to have a road map out of this situation. 21% is an unacceptable number."
"Education of our children is the second -- and adult education for parents who want to get new or better jobs," said Bryant. "We believe these issues are on the radar screen of the Governor and General Assembly, and we're making recommendations that are practical."
Kids' Count Proposals - and Big Picture
"There have been some recent gains," noted Bryant. "Not only did we make gains with the Race to the Top early learning challenge, we just won one of 13 preschool expansion grants in a competitive national competition -- $19 million over four years with a focus on low income children. Rhode Island already has a solid plan as part of the funding formula to have a high quality. pre-K program, and to have an expansion plan built into the fund formula. They took notice of that when they awarded the grant -- these dollars will simply accelerate the number of children served faster. They saw that we we had the planning to do so.
"You wouldn't want to start a baseball game in the 5th inning -- we're starting to prioritize early child education," continued Bryant. "And we're continuing to make gains with full day kindergarten. The General Assembly has made this a priority, with a full day K incentive to help provide one time start up costs.
"When you see indicators going in the wrong direction, these are ones going in the right one," said Bryant.
Rhode Island's Most Unemployed Cities and Towns

#39 Narragansett
Latest Unemployment Rate: 6.0
Labor Force: 9,244
Employed: 8,688
Highest Rate in Last Two Years: 9.0 (January 2012)
Lowest Rate in Last Two Years: 5.6 (September 2012, June 2013)

#37 (Tie) Jamestown
Latest Unemployment Rate: 6.5
Labor Force: 3,014
Employed: 2,818
Highest Rate in Last Two Years: 9.5 (February 2012)
Lowest Rate in Last Two Years: 5.7 (June 2013)

#37 (Tie) New Shoreham
Latest Unemployment Rate: 6.5
Labor Force: 1,507
Employed: 1,409
Highest Rate in Last Two Years: 30.9 (February 2012)
Lowest Rate in Last Two Years: 5.0 (August 2011)
#36 Barrington
Latest Unemployment Rate: 6.8
Labor Force: 8,211
Employed: 7,651
Highest Rate in Last Two Years: 8.8 (August 2011)
Lowest Rate in Last Two Years: 6.4 (April, May, July 2013)

#35 Richmond
Latest Unemployment Rate: 6.9
Labor Force: 4,316
Employed: 4,018
Highest Rate in Last Two Years: 8.5 (February 2012)
Lowest Rate in Last Two Years: 5.2 (May 2013)

#34 Glocester
Latest Unemployment Rate: 7.2
Labor Force: 5,893
Employed: 5,470
Highest Rate in Last Two Years: 10.7 (February 2012)
Lowest Rate in Last Two Years: 6.4 (June 2013)
#33 North Kingstown
Latest Unemployment Rate: 7.3
Labor Force: 15,033
Employed: 13,939
Highest Rate in Last Two Years: 10.5 (January, February 2012)
Lowest Rate in Last Two Years: 6.6 (June 2013)
#32 Little Compton
Latest Unemployment Rate: 7.4
Labor Force: 1,904
Employed: 1,763
Highest Rate in Last Two Years: 12.4 (January 2012)
Lowest Rate in Last Two Years: 6.9 (April 2013)
#31 Middletown
Latest Unemployment Rate: 7.5
Labor Force: 7,917
Employed: 7,325
Highest Rate in Last Two Years: 13.5 (January 2012)
Lowest Rate in Last Two Years: 7.1 (June 2013)
#30 Portsmouth
Latest Unemployment Rate: 7.6
Labor Force: 9,362
Employed: 8,651
Highest Rate in Last Two Years: 11.5 (January 2012)
Lowest Rate in Last Two Years: 6.6 (June 2013)
#28 (Tie) Bristol
Latest Unemployment Rate: 8.0
Labor Force: 12,455
Employed: 11,457
Highest Rate in Last Two Years: 10.6 (January 2012)
Lowest Rate in Last Two Years: 6.6 (June 2013)
#28 (Tie) Westerly
Latest Unemployment Rate: 8.0
Labor Force: 11,917
Employed: 10,961
Highest Rate in Last Two Years: 11.2 (February 2012)
Lowest Rate in Last Two Years: 6.8 (September 2012)
#27 Smithfield
Latest Unemployment Rate: 8.3
Labor Force: 11,781
Employed: 10,799
Highest Rate in Last Two Years: 10.4 (August 2011, February 2012)
Lowest Rate in Last Two Years: 5.7 (June 2013)
#25 (Tie) Foster
Latest Unemployment Rate: 8.4
Labor Force: 2,701
Employed: 2,475
Highest Rate in Last Two Years: 13.4 (February 2012)
Lowest Rate in Last Two Years: 7.9 (June 2012)
#25 (Tie) N. Smithfield
Latest Unemployment Rate: 8.4
Labor Force: 3,014
Employed: 2,818
Highest Rate in Last Two Years: 9.8 (August 2012)
Lowest Rate in Last Two Years: 7.4 (December 2012)
#23 (Tie) Coventry
Latest Unemployment Rate: 8.6
Labor Force: 20,279
Employed: 18,537
Highest Rate in Last Two Years: 11.1 (August 2011, February 2012)
Lowest Rate in Last Two Years: 7.1 (June 2013)
#23 (Tie) Cumberland
Latest Unemployment Rate: 8.6
Labor Force: 19,055
Employed: 17,422
Highest Rate in Last Two Years: 10.4 (August 2011, July 2012)
Lowest Rate in Last Two Years: 7.4 (June 2013)
#20 (Tie) Newport
Latest Unemployment Rate: 8.7
Labor Force: 12,885
Employed: 11,763
Highest Rate in Last Two Years: 14.1 (January 2012)
Lowest Rate in Last Two Years: 7.2 (September 2012)
#20 (Tie) Warwick
Latest Unemployment Rate: 8.7
Labor Force: 46,308
Employed: 42,297
Highest Rate in Last Two Years: 9.5 (February 2012)
Lowest Rate in Last Two Years: 10.4 (August 2011)
#20 (Tie) West Greenwich
Latest Unemployment Rate: 8.7
Labor Force: 3,678
Employed: 3,359
Highest Rate in Last Two Years: 11.7 (February 2012)
Lowest Rate in Last Two Years: 6.6 (June 2013)
#19 East Greenwich
Latest Unemployment Rate: 8.9
Labor Force: 6,784
Employed: 6,178
Highest Rate in Last Two Years: 11.0 (February 2012)
Lowest Rate in Last Two Years: 7.5 (June 2013)
#15 (Tie) Charlestown
Latest Unemployment Rate: 9.0
Labor Force: 4,506
Employed: 4,099
Highest Rate in Last Two Years: 14.2 (January 2012)
Lowest Rate in Last Two Years: 7.1 (June 2013)
#15 (Tie) Lincoln
Latest Unemployment Rate: 9.0
Labor Force: 11,781
Employed: 10,717
Highest Rate in Last Two Years: 10.4 (February 2012)
Lowest Rate in Last Two Years: 7.9 (November 2012, June 2013)
#15 (Tie) South Kingstown
Latest Unemployment Rate: 9.0
Labor Force: 16,455
Employed: 14,982
Highest Rate in Last Two Years: 10.6 (January 2012)
Lowest Rate in Last Two Years: 7.8 (September 2012)
#15 (Tie) Warren
Latest Unemployment Rate: 9.0
Labor Force: 5,908
Employed: 5,377
Highest Rate in Last Two Years: 12.0 (February 2012)
Lowest Rate in Last Two Years: 7.6 (June 2013)
#14 Exeter
Latest Unemployment Rate: 9.2
Labor Force: 3,865
Employed: 3,509
Highest Rate in Last Two Years: 11.7 (March 2012)
Lowest Rate in Last Two Years: 7.6 (September 2011)
#13 Tiverton
Latest Unemployment Rate: 9.3
Labor Force: 8,882
Employed: 8,058
Highest Rate in Last Two Years: 12.0 (January, February 2012)
Lowest Rate in Last Two Years: 7.4 (June 2013)
#10 (Tie) Cranston
Latest Unemployment Rate: 9.5
Labor Force: 41,657
Employed: 37,682
Highest Rate in Last Two Years: 11.3 (July 2012)
Lowest Rate in Last Two Years: 8.8 (April 2013)
#10 (Tie) East Providence
Latest Unemployment Rate: 9.5
Labor Force: 24,677
Employed: 22,339
Highest Rate in Last Two Years: 12.6 (January, February 2012)
Lowest Rate in Last Two Years: 8.7 (June 2013)
#10 (Tie) West Warwick
Latest Unemployment Rate: 9.5
Labor Force: 16,240
Employed: 14,693
Highest Rate in Last Two Years: 12.9 (February 2012)
Lowest Rate in Last Two Years: 8.4 (June 2013)
#8 (Tie) Hopkinton
Latest Unemployment Rate: 9.8
Labor Force: 4,888
Employed: 4,411
Highest Rate in Last Two Years: 11.2 (February 2012)
Lowest Rate in Last Two Years: 6.6 (June 2012)
#8 (Tie) North Providence
Latest Unemployment Rate: 9.8
Labor Force: 18,130
Employed: 16,347
Highest Rate in Last Two Years: 11.3 (August 2011)
Lowest Rate in Last Two Years: 8.5 (April 2013)
#7 Burrillville
Latest Unemployment Rate: 10.0
Labor Force: 9,526
Employed: 8,570
Highest Rate in Last Two Years: 11.6 (February 2012)
Lowest Rate in Last Two Years: 8.0 (June 2013)
#6 Scituate
Latest Unemployment Rate: 10.4
Labor Force: 6,166
Employed: 5,527
Highest Rate in Last Two Years: 11.2 (July 2012)
Lowest Rate in Last Two Years: 8.4 (June 2013)
#5 Johnston
Latest Unemployment Rate: 10.5
Labor Force: 15,645
Employed: 14,004
Highest Rate in Last Two Years: 12.9 (February 2012)
Lowest Rate in Last Two Years: 9.2 (June 2013)
#4 Pawtucket
Latest Unemployment Rate: 11.1
Labor Force: 36,412
Employed: 32,378
Highest Rate in Last Two Years: 13.7 (July 2012)
Lowest Rate in Last Two Years: 10.2 (June 2013)
#3 Woonsocket
Latest Unemployment Rate: 11.2
Labor Force: 20,730
Employed: 18,409
Highest Rate in Last Two Years: 13.6 (January 2012)
Lowest Rate in Last Two Years: 10.7 (June 2013)
#2 Providence
Latest Unemployment Rate: 11.5
Labor Force: 80,605
Employed: 71,362
Highest Rate in Last Two Years: 14.3 (August 2011)
Lowest Rate in Last Two Years: 10.4 (May 2013)
#1 Central Falls
Latest Unemployment Rate: 12.1
Labor Force: 8,348
Employed: 7,341
Highest Rate in Last Two Years: 15.3 (January, February 2012)
Lowest Rate in Last Two Years: 11.4 (April 2013)


