

RI Schools' Report Cards - Who Met Expectations and Who Didn't
GoLocalProv News Team
RI Schools' Report Cards - Who Met Expectations and Who Didn't
The data shows a dramatic difference in performance in different school districts across the state.
And, there is a wild difference in spending per pupil and there is little correlation between the per pupil spending and the performance. Pawtucket and Providence schools had among the lowest percentage of students meeting or exceeding expectations -- but the per-pupil spending for Pawtucket is just $16,653, and Providence is $22,322. Barrington schools have the highest achievement and nearly identical per pupil spending level at Pawtucket. Barrington spends $16,639 per pupil.
GET THE LATEST BREAKING NEWS HERE -- SIGN UP FOR GOLOCAL FREE DAILY EBLASTSEE THE RESULTS FOR EACH SCHOOL DISTRICT BELOW
The percentage of students meeting or exceeding expectations in a range of districts is under 10% for one of the three measures -- English Language Arts, Math and Science. In the Central Falls school district, 93% of students failed to meet expectations for all three subjects. In contrast, in Barrington, that number was 40% or lower.
According to RIDE, this marks the first release of Rhode Island’s Star Rating system post-pandemic, which details school performance data under the Every Student Succeeds Act (ESSA). The Star Rating simplifies and summarizes overall school performance classifying schools from 1 to 5 stars to provide families and school communities a transparent, accessible, and easy-to-understand snapshot of school performance. The Star Ratings, and school accountability data, are housed within the online Report Card platform.
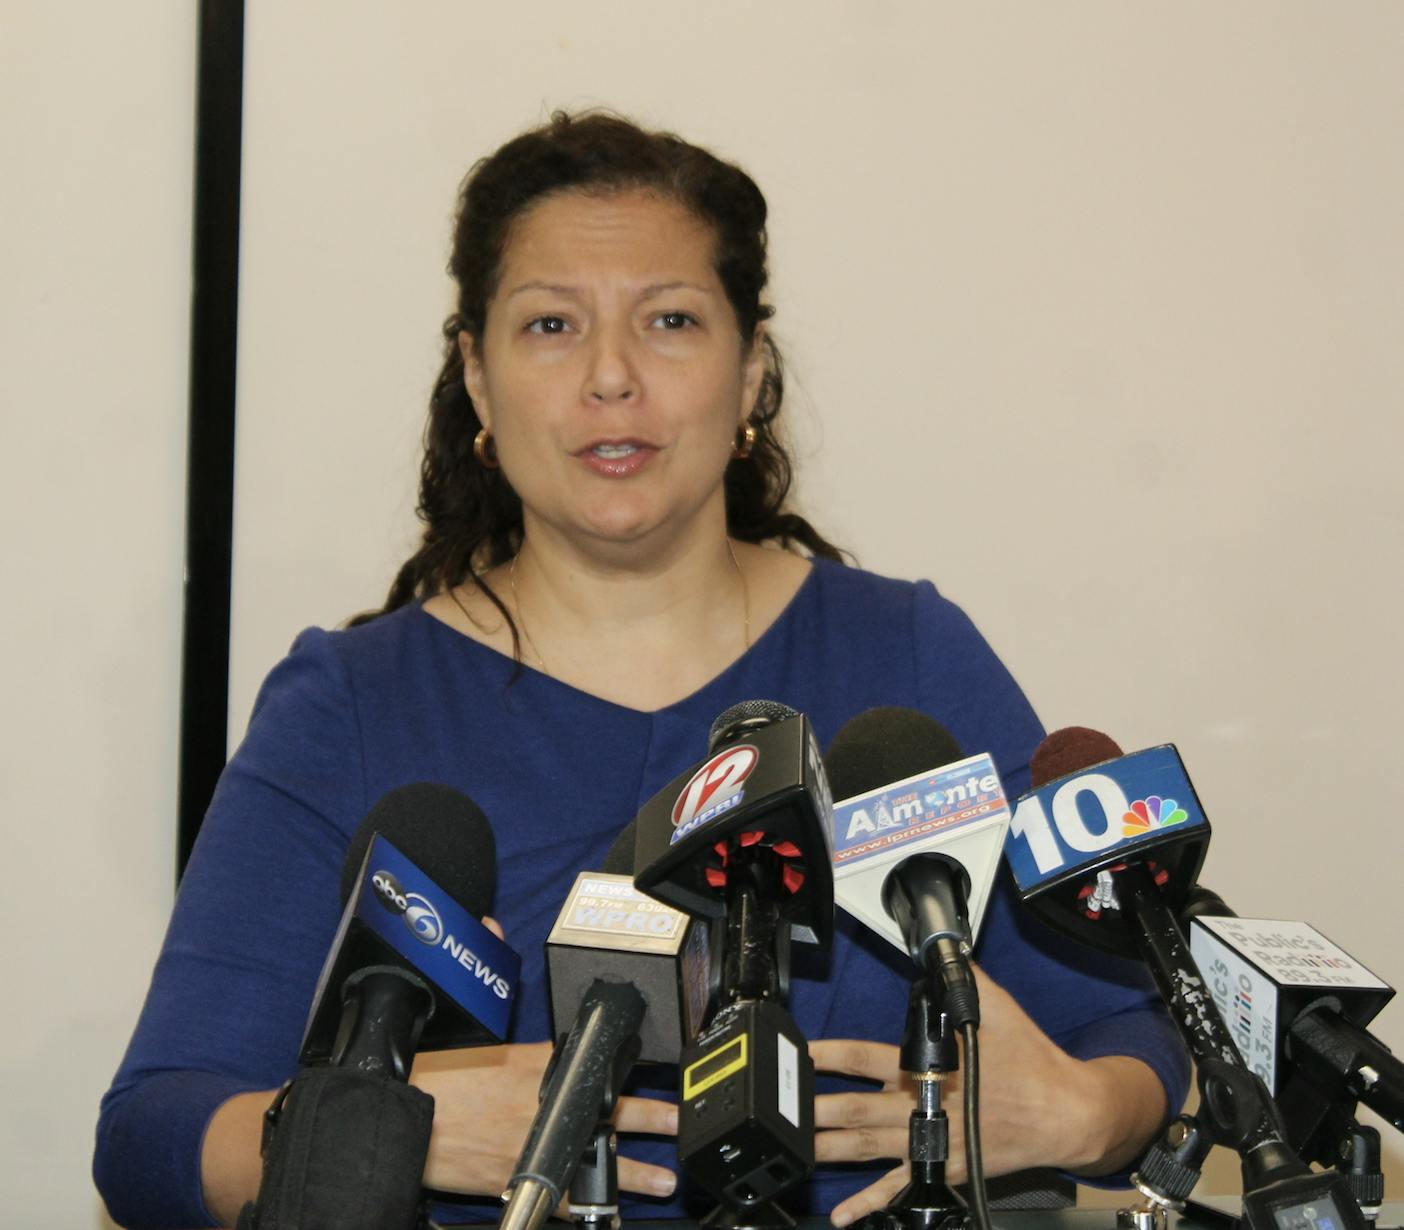
“The snapshot released [Friday] underscores the significant impact of the COVID-19 pandemic on our education system and the need for continued targeted academic, social and emotional supports in our schools, particularly among our most vulnerable populations,” said Commissioner Angélica Infante-Green. “To stem the broader impact of the pandemic, we are committed to working closely with school leaders to continue to build and expand programs to help our schools accelerate learning and guide our students forward. We share our gratitude with the Rhode Island education community, who will use this data responsibly to inform families of their students’ schools and improve student outcomes across the board.”
Statewide, there are 14 5-star schools, 28 4-star schools, 116 3-star schools, 94 2-star schools, and 38 1-star schools. Within the 1-star category, there are 21 schools identified for Comprehensive Support and Improvement (CSI), a federal designation for a state’s lowest-performing schools.
CSI schools are eligible for additional federal funding to support school improvement plans. Search for an individual school or a charter HERE.
SEE THE RESULTS FOR EACH SCHOOL DISTRICT BELOW
RI Public School Performance - LEA 2022

Barrington Public Schools

Bristol-Warren Public Schools

Burrillville Public Schools

Central Falls Public Schools

Chariho Public Schools

Cranston Public Schools

Cumberland Public Schools

East Greenwich Public Schools

East Providence Public Schools

Exeter-West Greenwich Public Schools

Foster-Glocester Public Schools

Johnston Public Schools

Lincoln Public Schools

Middletown Public Schools

Narragansett Public Schools

Newport Public Schools

North Kingstown Public Schools

North Providence Public Schools

North Smithfield Public Schools

Pawtucket Public Schools

Portsmouth Public Schools

Providence Public Schools

Smithfield Public Schools

South Kingstown Schools

Tiverton Public Schools

Warwick Public Schools

West Warwick Public Schools

Westerly Public Schools

Woonsocket Public Schools


