

Lardaro Report: Economic Conditions Slip in January
Len Lardaro, URI Professor of Economics
Lardaro Report: Economic Conditions Slip in January
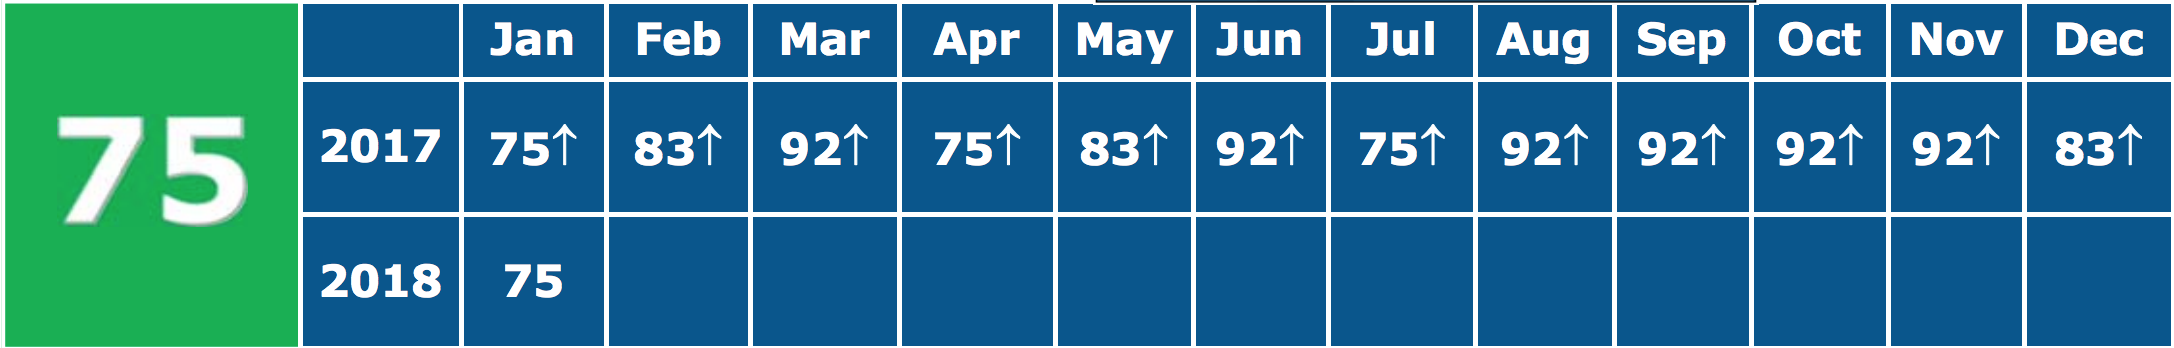
In my last several reports, I had called attention to the monthly divergences in the trends of the two labor market surveys. The establishment-based (CES) survey, from which payroll employment is obtained, no longer shows the prior monthly deterioration. Instead, there is now an acceleration over the past four months, although from reduced levels associated with rebenchmarking. The household survey, from which we derive our Unemployment Rate and related data, tells largely the same story it had prior to data revisions, where monthly deterioration is readily apparent in the most recent four months. The most noteworthy development with this survey, however, is its apparent adoption of some bizarre smoothing method. The inevitable result: long stretches with identical values for key indicators. For example, in 2017, the Unemployment Rate remained at 4.4 percent from March through August, before rising to and remaining at 4.5 percent from September through December and into January of 2018. For the record: I don’t believe these identical value strings for one minute, and neither should you! The most likely result of this will be that our Unemployment Rate will tend to consistently understate the actual rate when it is rising and overstate it when it is falling. In my field, that’s known as “systematic error.” I guess it’s time for me to dust off my econometric models and report what the values most likely should be, absent such bizarre smoothing.
GET THE LATEST BREAKING NEWS HERE -- SIGN UP FOR GOLOCAL FREE DAILY EBLAST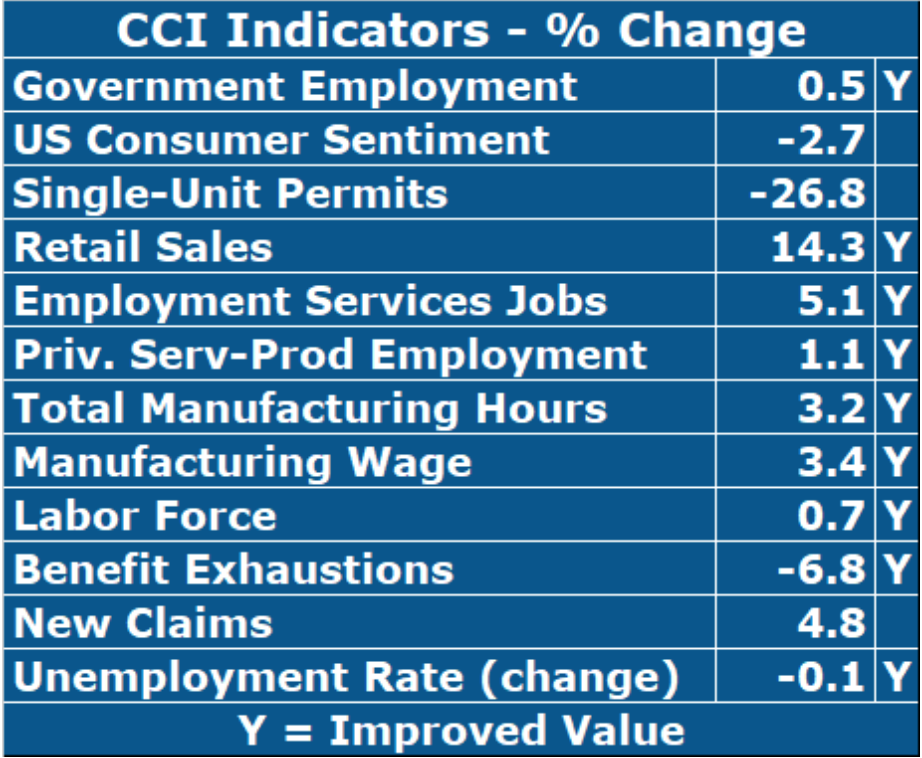
Employment Service Jobs, a leading labor market indicator, was revised higher throughout much of 2017, responsible for many of the increased CCI values last year. Its recent growth has exceeded 5 percent since July of last year. Total Manufacturing Hours, a proxy for manufacturing output, rose by a respectable 3.2 percent, as employment expanded but the workweek contracted slightly. New Claims, the timeliest measure of layoffs, rose by 4.8 percent, the third time it has failed to improve in the past five months, calling its downtrend into question. US Consumer Sentiment failed to improve again in January (-2.7%), following what had been a streak of thirteen consecutive increases. Single-Unit Permits, which reflect new home construction, fell sharply in January (-26.8%).
Retail Sales grew by at a double-digit rate in January (14.3%). Government Employment rose from its level a year ago, having been revised higher for the final three months last year. Private Service-Producing Employment growth remained above one percent and was also revised higher last year. Benefit Exhaustions, which reflects longer-term unemployment, fell by 6.8 percent. Our Unemployment Rate remained barely below its value a year ago, while our Labor Force rose for the seventh consecutive month, while still sustaining its long-term downtrend.
17 Biggest Business Stories of 2017

#17
Forbes Features RI’s “Bangle Billionaire,” Alex and Ani Founder Rafaelian
It is not often a Rhode Island business leader scores the cover of Forbes -- it may be never before that a Rhode Island woman took home the honor.
It is not a little blurb. Forbes ran an eight-page feature in its June issue titled, “How Alex And Ani Founder Carolyn Rafaelian Built An American Jewelry Empire.”
The Rafaelian feature was part of its cover story, "The Richest Self-Made Women. Forbes listed the top 60 self-made women, and Rafaelian came in at #18 at $1 billion. Leading the list was Marjian Ilitch, age 84 of Little Caesars at $5.1 billion.
Oprah Winfrey ranked #5 at $2.9 billion and Beyonce Knowles at #46 at $350 million.
The piece chronicled the growth of Alex and Ani and her involvement in everything from restoring Belcourt Castle to her vineyard in Little Compton.
As Forbes wrote, “Rafaelian has invested many millions in the estate, including a complete renovation of the library. She also added solar paneling to the roof and, of course, restored Alva's (Vanderbilt’s) bedroom to its Gilded Age glory.”
The total cost of the restoration of Belcourt? Unreported.
This news was the latest that week coming out of Alex and Ani, as, "Model, entrepreneur and activist Gisele Bündchen, co-anchor of Good Morning America Robin Roberts; and founder and CEO of ALEX and ANI Carolyn Rafaelian were among the women recognized...in New York City by the David Lynch Foundation (DLF), a global charitable organization that addresses the epidemic of trauma and toxic stress amongst at-risk populations."

#16
RI's Real Estate
Prices are up and up and up. Great for sellers, but bad for Rhode Island buyers. For those coming in from Boston or moving up from New York, everything is selling at a discount.
While James Woods is selling his house (first reported by GoLocal), Jay Leno has bought Rick Brady's Newport Mansion Seafair (also first reported by GoLocal).
Real estate could be the biggest business story in Rhode Island if Boston continues its growth.

#15
Fane's Tower Withers -- Whither 195?
It was going to be a reshaping of the Providence skyline and the transformation of city living. The three massive towers were going to pour hundreds of millions into the Rhode Island economy during the construction phase.
NY developer Jason Fane was going to tap off his career by reinventing Providence. Now, it is all quiet on the Hope Tower front.
Time will tell if Fane will see action back at the 195 Commission in 2018.

#14
Benrus Implosion
It was supposed to be the next big company in Rhode Island. But, now just three years later, it is in receivership.
The historic watch brand was going to be transformed into a leading lifestyle brand. There was a retail store in New York, sponsorships of the Boston Celtics and the Buffalo Bills, and so much more.
Giovanni Feroce lived in a Newport mansion and the decline of the company and the foreclosure on the multi-million home were all newsmakers.
Now, Feroce is considering a run for Governor of Rhode Island in 2018, proving the adage that fact is stranger than fiction.

#13
RI Commerce Spends Two-Thirds of its $12M in Contracts with Out-of-State Companies
In June, a GoLocal investigation found that under Governor Gina Raimondo, the agency in charge of building Rhode Island’s economy had spent 65 percent of its contract dollars with out-of-state companies in the last two years.
Nearly $8 million of taxpayer dollars went to consultants as far away as New York, Toronto, London, and Frankfurt under the Rhode Island Commerce Corporation. Even the money spent on porta-johns contracted for Volvo races went to out-of-state interests by an overwhelming margin.
According to a GoLocal investigation, over $164,000 went to United Site Services NE Inc., a Massachusetts-based company, for the Newport sailing event - and there are a number of Rhode Island-based companies. One Rhode Island company, Hallman Septic Svc. & Portable Toilets LLC, received payments for $67,500.
Havas Got as Much as All of Rhode Island
No companies scored more consulting dollars than consulting businesses located in New York. Havas, the public relations firm that oversaw the development of the tourism campaign that included the now infamous promotion video for Rhode Island that included footage from Iceland, received payment in the past two years more than $4 million — $4,114,025.78 according to data provided to GoLocal from Commerce.
Havas was paid nearly as much as all Rhode Island contracts combined during the past two years.
Of the 136 contracts let by Commerce, Rhode Island-based companies received just $4,482,234.48 of the $12,475,469.90 in the past two years.
Commerce sent more than $6M to NY-based firms
It appears that Commerce "loves New York" as the New York City area received contracts from Commerce that top more than $6 million -- more than 25 percent more than RI-based companies.
Commerce’s Mission
According to the mission statement of the agency, “The Commerce Corporation works with public, private and non-profit partners to create the conditions for businesses in all sectors to thrive and to improve the quality of life for our citizens by promoting the state's long-term economic health and prosperity.”
However, the spending pattern of the agency shows that the contracts go to research firms all over America and the world — some with specialties similar to Rhode Island firms.

#12
Wexford Moves Forward
A GoLocal investigation uncovered that claims about the Wexford project were full of bluster.
A GoLocal investigation into claims of job creation by state officials at the 195 Wexford project were at best hyper-inflated.
Governor Gina Raimondo has repeatedly claimed that the $32 plus million in public subsidies will create 1,000 new permanent jobs in Rhode Island. After weeks of requesting information about tenants, rents, and job creation, GoLocal was finally able to secure actual job numbers for the project and then fact check those claims.
In fact, actual jobs created will be closer to 80 to 90, at a cost of more than $32 million.
As an example, the project claims 706 permanent jobs will be created by building de facto spec space for Cambridge Innovation Center (CIC), but CIC itself promises only a handful of jobs.
The CIC is a tenant of Wexford and CIC will be leasing the state-subsidized office space for lease. The practice of claiming tenant space as job creation is specifically flagged by federal watchdogs as improper (see below).
“Where's the due diligence that provides a basis for these estimates? Assuming fixed proportions based on square footage is almost certainly going to prove overly optimistic,” said URI Professor of Economics Len Lardaro, when alerted to the job claims.
As one example, as part of the 1,000 new jobs being created is the claim that Brown University will be creating 100 new jobs. However, Brown only anticipates creating 15 jobs at the outset.
“Of the 100 university positions expected at the Innovation Center upon its anticipated opening in early 2019, approximately 15 will be new jobs — our School of Professional Studies currently employs approximately 85 people and expects to grow to approximately 100 prior to the opening of the new space,” according to Brian E. Clark, the Director of News and Editorial Development at Brown University.

#11
RI Pharma Alexion Closing Plant and Cutting 250 Jobs
Alexion Pharmaceuticals Inc. announced in September it was pulling out of Rhode Island and slashing jobs. The cuts in Rhode Island are at the Alexion plant in Smithfield — once the site of the failed Alpha Beta facility.
Rhode Island will realize job loss of 250 with Alexion's departure and the news hit just days after Benny’s announced the company’s closing and the loss of over 700 full and part-time jobs in the region.
"We are disappointed by today's news regarding Alexion’s restructuring moves. Our number one priority is ensuring that every Rhode Islander currently employed at Alexion is able to transition to other work. The Department of Labor and Training will be working with Alexion officials on re-employment of their employees and the Commerce Corporation will be working with them on repurposing the facility,” said RI Commerce in a statement.
The winner in the Alexion slashing is Boston, of course. The company announced that in addition to closing the RI facility and slashing jobs, it is moving its headquarters from New Haven, CT to Boston.

#10
CNBC’s Top States for Business Unveiled—RI Ranked Dismal 45th
CNBC’s annual ranking on the Top States for Business for 2017 found Rhode Island coming in at the bottom end of the rankings at #45.
In 2016, Rhode Island ranked 50th. For Governor Gina Raimondo, the 2017 ranking is slightly better than 2016, but still an embarrassing ranking on the eve of the National Governors meeting in Providence.
Raimondo, who ran for Governor in part on trumpeting her business experience, but even after handing out over $100 million in incentives -- much of it to out-of-state concerns, her strategies have failed to significantly spark the economy. This is Raimondo's third year in office.
About the Rankings
RI ranks 50th for Infrastructure, 44th for Access to Capital, 43rd for Cost of Doing Business, and 42nd for Cost of Living.
Rhode Island ranked 48th in 2015, 50th in 2014, and 49th in 2013.
In 2017, the state of Washington was ranked #1 by CNBC.

#9
Infosys in Providence
RI Commerce is refusing to disclose any details of Governor Gina Raimondo’s latest deal other than to say, “When Infosys applies for tax credits, we are estimating the total amount to be in the neighborhood of $10 million.”
The Indian-based consulting and technology company has promised to create 500 jobs to Rhode Island, but questions about the jobs -- and future of the company -- surround the deal. Can the company move existing jobs and realize taxpayer subsidies? And, will foreign workers be eligible for the incentive program? Infosys and Raimondo say in the jobs will be American, but RI Commerce refuses to answer these questions.
In the past, Citizens Bank has tapped Infosys for substantial tech support. In 2015, Citizens laid off more than 350 workers in RI and outsourced the jobs to IBM. "The total layoff estimate by employees ranges from 250 to 350," reported Computerworld at the time, who interviewed four Citizen IT employees: "Two were interviewed by phone, and two by email and only on condition of anonymity."
For the past four years, Infosys has been hit with a number of controversies.
Reuters reported in 2013 that Infosys agreed to pay $34 million to end a U.S. investigation related to flying workers to client sites in the United States on temporary visas, the issue of worker visas -- H-1B visas in particular -- has continued to persist.
In April 2017, the Times of India pointed out that Infosys continued to come under United States scrutiny for visa issues:
The US has complained that Indian blue-chip IT firms Tata Consultancy Services, Infosys and Cognizant unfairly get the lion's share of H-1B visas by putting extra tickets into the lottery system, which the Trump administration wants to replace with a 'merit-based' immigration policy.

#8
Amazon HQ2
It's hard to tell if Rhode Island is serious about trying to woo Amazon's second headquarters to the state. The proposal was submitted the last day and Governor Gina Raimondo's Commerce Secretary Stefan Pryor has refused to allow the public or the media review the incentives being offered to Amazon.
Rhode Island Commerce Secretary Stefan Pryor said:
“The Rhode Island Commerce Corporation today is submitting a proposal for Amazon’s HQ2 on behalf of the State of Rhode Island, its municipalities, and the Partnership for Rhode Island. The proposal includes sites in our capital city as well as across the Ocean State. Our application package lays out the partnerships, business climate, quality of life and incentives that make Rhode Island attractive – and make our proposal competitive.
“We are posting our website, which was created for this purpose, as well as releasing a list of submitted locations and key renderings. We will not be publicly releasing the detailed materials that are subject to negotiation.
“Rhode Island universities collaborate frequently and we are grateful to them for coming together on one of the key initiatives in this proposal: ‘Amazon Academy.’ We envision Amazon employees obtaining the professional development and continuing education they need to advance Amazon’s goals through this initiative. The Academy will braid together offerings from Rhode Island’s colleges and universities and will serve as a one-stop-shop for Amazon employees to access programming that is tailored to the company.

#7
Virgin Pulse's RI Expansion
In December of 2016, Virgin Pulse announced at a State House press conference that the company would grow its footprint in Providence from about 75 in the jewelry district to upwards of 300. The company is slated to receive $5.7 million in subsidies from RI Commerce. The agency approved the package in late 2016.
Virgin Pulse acquired Shape-Up, the Rhode Island-based work wellness company founded by Dr. Rajiv Kumar. The expanded RI footprint will be located in downtown of Fountain Street -- in the building which was housed the Providence Journal exclusively. Now, the office building has been rehabbed for multiple companies. Virgin Pulse is expected to move its Framingham, MA headquarters to Providence.
Last year, GoLocal selected Kumar as one of the “16 Who Made a Difference in 2016.”

#6
Deepwater Wind
Maybe no one in Rhode Island or in America had a better year than Deepwater's CEO Jeff Grybowski.
His first project and America's first offshore wind project just turned one year old. Now, he is competing to vastly expand wind operations throughout New England and New York.
Grybowski and Deepwater are the focus of Citi's new national advertising campaign.

#5
EXCLUSIVE: Hasbro World HQ Could Be Built in Providence and Superman Could Come Down
An exclusive story first reported by GoLocal, unveiled what could be the biggest business story to hit Providence in decades.
GoLocal learned that a plan by two real estate mega-forces, Providence developer Joe Paolino of Paolino Properties and Bob Gilbane of Gilbane Development, is emerging that would build an approximately 36 story tower at the location of the now vacant Superman Building.
The new structure is being pitched to Hasbro for its new consolidated headquarters. The Paolino and Gilbane plan is just one of a number of plans submitted, but the only one that includes the demolition of the Superman building. Some of the other proposed offered for Hasbro's consideration include building a campus for Hasbro on 195 lands. Other potential developers include Procaccianti Companies who "has owned, developed or managed millions of square feet of real estate." The company owns the Renaissance Hotel in Providence to name just one of its holdings.
Reaction to the "Hasbro Tower" was immediate and varied across the business community and the public. Top government financial expert Gary Sasse joined GoLcoal's Business Monday just an hour after GoLocal broke the story and Sasse said the new tower and the demolition of Superman building is a win-win. See more on his appearance on GoLocal.
Bob Whitcomb, former Editor of the editorial page of the Providence Journal and now GoLocal contributor said the proposal was a plus for Providence as the existing vacant building faces too many challenges to ever be restored.
As previously reported Hasbro is in some level of talks to acquire rival toy company Mattel. Today, Hasbro is enjoying a high performing stock, the top ranking in the best corporate citizen ranking list, and growing profits. The company employs a reported 1,600 in Rhode Island and 5,400 globally.

#4
Benny's Closing
"Fredo, you broke my heart" is one of the most memorable lines from the Godfather trilogy - and a fitting sentiment to the end of a Rhode Island institution.
The closure of Benny's 31 stores in southern New England is a shinning, in your face, an example of Amazon's growing power, the death of brick and mortar retail, and a lesson to everyone in business -- innovate or die.

#3
Biggest Employment Sector is in Chaos -- Healthcare
GoLocal broke the story of the move by Partners to acquire Care New England. The financially failing hospital group is on the edge -- losing nearly $120 million in the past two years.
The industry is being hit from nearly every side:
Lifespan after posting significant losses in 2016, barely breaking even this year.
St. Joseph Pension Fund Collapse - impacting CharterCare
Owners of Landmark, Prime Healthcare, fined $1 million by Department of Health
Memorial Hospital forced to close by Care New England - knocking more than 500 (after a UNAP agreement) out of jobs.

#2
T.F. Green's Rapid Growth
Up, up and away. T.F. Green has been one of the biggest success stories in Rhode Island -- this year or any other.
The addition of more than a half-dozen new carriers, international flights to almost a dozen locations, and economic impact on Rhode Island has been unmatched.
When sometimes the rest of Rhode Island's economy appears to be a roller coaster, the good news from Iftikhar Ahmad seems endless.

#1
CVS and Aetna Deal - One of the Biggest Transactions in Business in the World in the Past 10 Years
CVS and Aetna finalized their agreement. The deal still faces federal regulatory review and the impact on Rhode Island won't be known for months or longer. The potential could be transformative for the positive or negative.
CVS Health President and Chief Executive Officer Larry J. Merlo said, “This combination brings together the expertise of two great companies to remake the consumer healthcare experience. With the analytics of Aetna and CVS Health’s human touch, we will create a healthcare platform built around individuals. We look forward to working with the talented people at Aetna to position the combined company as America’s front door to quality health care, integrating more closely the work of doctors, pharmacists, other healthcare professionals and health benefits companies to create a platform that is easier to use and less expensive for consumers.”
The deal is big. A GoLocal analysis found that a combined CVS and Aetna company will be the second largest revenue company in the United States — at $240 billion — ahead of Apple ($215B) and Berkshire Hathaway ($223B). The only company in America doing more revenue would be Walmart ($485B).
The biggest winner in the proposed acquisition of Aetna by CVS may be Rhode Island. The deal is one of the biggest business deals in the United States will transform the company and its roll in healthcare in America.


