

Lardaro Report: Year-Over-Year Employment Growth Falls Below 1%
Len Lardaro, URI Professor of Economics
Lardaro Report: Year-Over-Year Employment Growth Falls Below 1%
While we continued to hope throughout the fourth quarter of 2015 that the slowing of economic activity we were experiencing would soon moderate, the revised (i.e., rebenchmarked) labor market data has rather abruptly informed us that things were not quite as rosy as what we had been led to believe. Payroll employment, or the number of jobs by Rhode Island firms, was actually revised higher in the new data starting in July of 2014. That’s about all of the good news. Even though employment was revised higher, its rate of growth has been both lower and slowing since September of last year. Worse yet, our original data indicated accelerating growth at the end of 2015. The revised data show exactly the opposite: instead of year-over-year employment growth approaching two percent, it actually fell below one percent!
GET THE LATEST BREAKING NEWS HERE -- SIGN UP FOR GOLOCAL FREE DAILY EBLAST
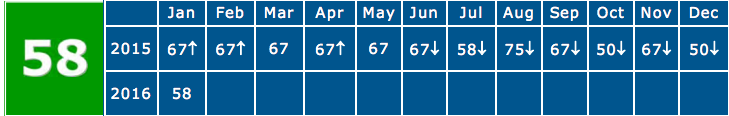
For January, the Current Conditions Index rose from its downwardly revised December value of 50 to 58. There was some good news for January. While the recent weak CCI values largely reflect the fact that our negatives have been growing relative to our positives, four of the five leading indicators contained in the CCI improved. Unlike past months, where much of our weakness has been concentrated in our goods-producing sector, for January, weakness was fairly widespread.
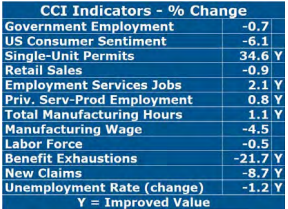
Retail Sales actually declined in January (-0.9%), following nineteen consecutive improvements. Private Service-Producing Employment, an indicator w hose actual grow th had been slowing, rose by only 0.8 percent in January. Government Employment fell again (-0.7%). Benefit Exhaustions, which reflects longer-term unemployment, declined by 21.7 percent relative to last year. Our Labor Force never had the recent yearly uptrend contained in the original data. Worse yet, it has continued to decline on both a monthly and yearly basis in January, falling back to its level in the second half of 2002! So, Rhode Island’s Unemployment Rate continues to fall for the wrong reasons.
Rhode Island began 2016 in much the same way it ended 2015: a slowing economy. What we only found out lately is that we are slowing from less robust levels of economic activity than existing data had led us to believe. Just last month, everyone was celebrating a fall in our jobless rate to 5.1 percent. Now we discover that our rates were actually higher at the end of 2015 and our Labor Force continually declined. What could be worse? Even though payroll employment was revised higher (since July of 2014), we ended 2015 with slowing rates of job growth, moving to below one percent growth! Let’s hope that the national economy boosts our momentum. Soon!
RI Business Rankings in US

WalletHub
Rhode Island has 2015's eighth highest insurance premium penalties for high risk drivers, according to a WalletHub report.
Rhode Island ranks fifth overall in the category of speeding over 20 mph annual premium increase at $482. While ranking third overall in the category of 2 accidents annual premium increase at $2,721.
Rhode Island ranks ninth overall under the reckless driving annual premium increase at $749.
WalletHub
Rhode Island has been ranked as the 8th most eco-friendly state in the country, according to a recent study by WalletHub.
Rhode Island ranks third in environmental quality and 16th in Eco-Friendly Behaviors Ran landing them in 8th overall.
RI is behind Washington and New Hampshire who are in the six and seven spots respectively, and in front of Connecticut and Hawaii who come in at the nine and ten spot.
WalletHub
Rhode Island is 2015's 4th Worst State to be a taxpayer, according to a recent WalletHub report.
Rhode Island ranks 48th of 51 with an average state and local tax price of $7,159 which is good for a 27% difference from the national average.
The states that are directly behind Rhode Island are Wisconsin at $7,159, Nebraska at $7,298 and Illinois at $7,719 for a 37% difference from the national average.
WalletHub
Rhode Island has the highest vehicle property taxes in the country, paying an average of $1,133 according to a report from WalletHub.
Virginia and Kansas are the two states just ahead of Rhode Island in the 49 and 50 spots, paying $962 and $905 respectively.
RI also ranks 42nd in average real estate tax, paying an average of $2,779, according to the WalletHub report.
WalletHub
WalletHub has ranked Rhode Island as the 7th worst state to be rich in in a recent in depth analysis of 2015's Best States to be Rich or Poor From a Tax Perspective.
On a scale with 1 being the best, and 25 being average, Rhode Island ranks 37th in low income earners, 42 in middle income earners and 45th in high income earners.
To see the full report, click here.
Gallup
Providence-metro ranks at the bottom for job creation in 2014
Rhode Island has been ranked amongst the worst in job creation, according to a recent survey done by Gallup.
Gallup gives the Prov-metro area an index score of 23, the lowest score is the New York- New Jersey area with 20.
Salt Lake City, Utah and Austin-round Rock, Texas rank the highest with a score of 37.
See the rest of the rankings here.
Forbes
The 2014 state rankings by Forbes has just been released and Rhode Island moved up two spots from #48 in 2013 to #46 in 2014.
What does Forbes say about RI's business environment"
After Michigan and Illinois, Rhode Island has experienced the third worst net migration out of its state in the country over the past five years. With a recent unemployment rate of 7.6%—lower than only Georgia and Mississippi—residents are leaving the state in search of jobs. Rhode Island has been stuck in the bottom five overall for six straight years. One plus: labor costs are 5% below the national average, which stands out in the expensive Northeast.

Tax Foundation
Findings from The State Business Tax Climate Index were released this morning by Tax Foundation which found Rhode Island to have the 45th best tax climate for businesses for 2015. The state's rank has not changed since last year after The Index analyzed 100 different tax variables in multiple categories.
Read more about the report here

WalletHub
After conducting an online suvery consisting of 1,050 individuals from both parties across the nation, WalletHub ranked Rhode Island as having America's 33rd fairest tax system.
Click here to view the poll's entire findings

Thumbtack/Kauffman
Providence is the second worst city in America for small business, according to a new survey conducted by Thumbtack.com and the Kauffman Foundation.
More than 12,000 small businesses in 82 cities across the country participate in the survey. Providence received an overall "F" grade for small business friendliness.

The Economist
Small Business Friendliness Grade: F
The Economist grades states on an A+ to F grading scale for its small business climate. Rhode Island is one of just 6 states to earn an "F" grade.
Overbearing bureaucracy and excessive licensing is stifling small business in America.
Read More About The Economist Grade Here
CNBC
CNBC ranks each state in cost of doing business, economy, technology and innovation.
Rhode Island's unemployment rate as of May 2014 was 8.2 percent. This is RI's lowest unemployment rate since August 2008.
Read More About CNBC Ranking Here
Forbes
Forbes ranks each state in business costs, economic climate, and growth prospects. RI is third worst in 2013.
The most damning in the commentary:
After Michigan, Rhode Island has experienced the second worst net migration in the country over the past five years.
Read More About Forbes Ranking Here
ChiefExecutive.net
#39 ChiefExecutive.net
ChiefExecutive.net ranks each state in taxations and regulations, workforce quality, and living environment.
The most damning in the commentary:
Sky-high unemployment rate bespeaks continuing terrible business climate.
Read More About ChiefExecutive.net Ranking Here

Tax Foundation
#46 Tax Foundation
Tax Foundation ranks each state in corporate tax rank, sales tax rank, and unemployment insurance tax rank.
Rhode Island and the other states in the bottom ten suffer from the same afflictions: complex, non-neutral taxes with comparatively high rates.
Read More About Tax Foundation Ranking Here
Wallet Hub
#24 Wallet Hub
Wallet Hub ranks each state in ROI rank, state tax rank, and overall government services.
Rhode Island ranked #50 for worst roads and bridges, but ranked #4 in safety.
Read More About Wallet Hub Ranking Here

ALEC
#47 ALEC
ALEC ranks each state in economic performance and outlook.
Although Rhode Island ranked low in economic performance, a forward-looking forecast is based on the state’s standing in 15 important state policy variables. Some of these variables include top marginal personal income tax rate and sales tax burden.
Read More About ALEC Ranking Here

Kauffman Foundation
#50 Kauffman Foundation
Kauffman Foundation ranks each state in entrepreneurship.
Entrepreneurial activity generally is highest in Western and Southern states
and lowest in Midwestern and Northeastern states.
Read More About Kauffman Ranking Here

Free Enterprise
#47 Free Enterprise
Free Enterprise ranks each state in performance, exports, innovation + entrepreneurship, business climate, talent pipeline, infrastructure.
Rhode Island has continued to feel the direct impact and ripples from the recent recession—it ranks 47th overall in economic performance. However, positive rankings of 15th in talent pipeline and 16th in innovation and entrepreneurship suggest the existence of a foundation on which to build the future.
Read More About Free Enterprise Ranking Here

The Pew Charitable Trusts
#40 The Pew Charitable Trusts
The Pew Charitable Trusts ranks each state in job growth and job creation.
Rhode Island added 6,223 jobs in 2014.
Read More About The Pew Charitable Trusts Ranking Here
Gallup
10th Worst in Gallup's Annual Ranking of State Job Markets 2014
Rhode Island has been ranked 10th worst for job creation in Gallup's annual ranking of state job markets in 2014 with a job creation index number of 21
Rhode Island is one of two (Connecticut) states to rank in the bottom ten each year since 2008.
The 2014 State level findings have were drawn from 201,254 interviews with employed adults across the nation.
See the full list of rankings here.


