

Lardaro Report: Progress of RI Economic Recovery Discouraging
GoLocalProv Business Team
Lardaro Report: Progress of RI Economic Recovery Discouraging

Lardaro points out that while the revised payroll data form 2013 shows more jobs than previously reported, the unemployment rate was also higher than original estimates.
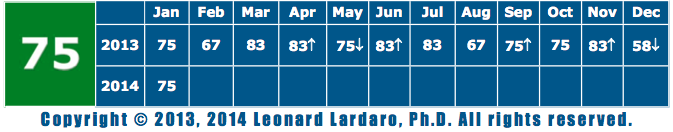
Lardaro's Current Conditions Index:
GET THE LATEST BREAKING NEWS HERE -- SIGN UP FOR GOLOCAL FREE DAILY EBLASTThe new year began with some happy news concerning Rhode Island employment: payroll employment was revised higher by 3,100 relative to the original estimate. But this is Rhode Island, where behind every silver lining lurks a gray cloud: our jobless rate, which was already either the highest or among the highest in the country, was also revised - even higher. So, there is some cause for celebration in the rebenchmarked payroll data, but the household survey data continues to paint a very discouraging picture as far as how this recovery is progressing.
How did Rhode Island’s cyclical economic momentum fare in light of the revised data? The Current Conditions Index, which was designed for this very purpose, also showed a continuation of the good news - bad news situation we have remained mired in for some time now. First, the good news: in light of the newly released labor market data, the CCI was revised higher for four months in 2013 (April, June, September, and November). And, for January, the CCI rose from the (downwardly revised) December value of 58 to 75, as nine of twelve indicators improved. Now for the bad news: the CCI was only revised lower for two months in 2013 (May and December), but the CCI values based on the new data show that the CCI has now failed to improve relative to its year-earlier value for six consecutive months and seven of the last eight months. So, while the values of several CCI indicators were revised higher, these upward revisions were not sufficient to permit us to exceed the favorable CCI values we experienced at the end of 2012 and into January of 2013. It should be noted though, that there were several ties (like this month).
For January, two of the CCI’s five leading indicators failed to improve. The first of these, Employment Service Jobs, includes temporary employment, which is a prerequisite to employment growth. It fell by 2.4 percent in January, which was its second consecutive decline. Continuation of its recent uptrend is now questionable as its values have apparently plateaued around 9,000 for the better part of a year. The other indicator, New Claims for Unemployment Insurance, the timeliest measure of layoffs, rose by 1.3 percent in January, its first failure to improve since last August. The downtrend in this indictor since July of 2013 may be ending. It will be necessary to observe its behavior over the next several months before any confirmation is possible, however.
Single-Unit Permits , managed to improve by 5.5 percent in January relative to its value one year ago, although weather- related factors make interpreting changes in this indicator very difficult. In spite of this, it is safe to conclude that Rhode Island is continuing to move beyond its cyclical trough in new home construction. US Consumer Sentiment rose at a double-digit rate in January (+10.1%), its second increase following three consecutive months of declines. Expect its uptrend to continue as long as the stock market improves. The final leading indicator, Total Manufacturing Hours, which measures strength in our manufacturing sector, barely rose in January (+0.2%), as a decline in the workweek almost offset the job gains that occurred. At least part of the decline in hours may be weather related.
Retail Sales have remained relatively strong overall although its rate of growth compared to a year ago has recently been declining. As was true for several of the other CCI indicators, weather has likely played some role this slowing rate of growth. Private Service-Producing Employment w as revised higher in the recent rebenchmarking. Its rate of growth, which had appeared to be slipping below 1%, remained above that level for all but one month during the last year. The performance of our state’s Labor Force must be described as ugly - its rates of decline went from bad to worse. It fell for the ninth consecutive month. What could be worse? For the past four months, rates of decrease have exceeded 1.5%! And in spite of this, Rhode Island once again claimed the #1 jobless slot in January. Our rate never fell below a value of 9%, contradicting the prior data. Finally, Government Employment rose slightly (by 0.2% ).
The news concerning the revisions to Rhode Island’s labor market data was mixed. While payroll employment was higher than we had thought, our unemployment rate was revised even higher than its prior levels. What is worse, Rhode Island’s jobless rate never fell be- low 9%. The present recovery continues to be less broadly based than it was a year ago, based on the fact that the CCI has now failed to exceed its year-earlier value for six consecutive months. Happy New Year, Rhode Island style!
Rhode Island's Most Unemployed Cities and Towns

#39 Narragansett
Latest Unemployment Rate: 6.0
Labor Force: 9,244
Employed: 8,688
Highest Rate in Last Two Years: 9.0 (January 2012)
Lowest Rate in Last Two Years: 5.6 (September 2012, June 2013)

#37 (Tie) Jamestown
Latest Unemployment Rate: 6.5
Labor Force: 3,014
Employed: 2,818
Highest Rate in Last Two Years: 9.5 (February 2012)
Lowest Rate in Last Two Years: 5.7 (June 2013)

#37 (Tie) New Shoreham
Latest Unemployment Rate: 6.5
Labor Force: 1,507
Employed: 1,409
Highest Rate in Last Two Years: 30.9 (February 2012)
Lowest Rate in Last Two Years: 5.0 (August 2011)
#36 Barrington
Latest Unemployment Rate: 6.8
Labor Force: 8,211
Employed: 7,651
Highest Rate in Last Two Years: 8.8 (August 2011)
Lowest Rate in Last Two Years: 6.4 (April, May, July 2013)

#35 Richmond
Latest Unemployment Rate: 6.9
Labor Force: 4,316
Employed: 4,018
Highest Rate in Last Two Years: 8.5 (February 2012)
Lowest Rate in Last Two Years: 5.2 (May 2013)

#34 Glocester
Latest Unemployment Rate: 7.2
Labor Force: 5,893
Employed: 5,470
Highest Rate in Last Two Years: 10.7 (February 2012)
Lowest Rate in Last Two Years: 6.4 (June 2013)
#33 North Kingstown
Latest Unemployment Rate: 7.3
Labor Force: 15,033
Employed: 13,939
Highest Rate in Last Two Years: 10.5 (January, February 2012)
Lowest Rate in Last Two Years: 6.6 (June 2013)
#32 Little Compton
Latest Unemployment Rate: 7.4
Labor Force: 1,904
Employed: 1,763
Highest Rate in Last Two Years: 12.4 (January 2012)
Lowest Rate in Last Two Years: 6.9 (April 2013)
#31 Middletown
Latest Unemployment Rate: 7.5
Labor Force: 7,917
Employed: 7,325
Highest Rate in Last Two Years: 13.5 (January 2012)
Lowest Rate in Last Two Years: 7.1 (June 2013)
#30 Portsmouth
Latest Unemployment Rate: 7.6
Labor Force: 9,362
Employed: 8,651
Highest Rate in Last Two Years: 11.5 (January 2012)
Lowest Rate in Last Two Years: 6.6 (June 2013)
#28 (Tie) Bristol
Latest Unemployment Rate: 8.0
Labor Force: 12,455
Employed: 11,457
Highest Rate in Last Two Years: 10.6 (January 2012)
Lowest Rate in Last Two Years: 6.6 (June 2013)
#28 (Tie) Westerly
Latest Unemployment Rate: 8.0
Labor Force: 11,917
Employed: 10,961
Highest Rate in Last Two Years: 11.2 (February 2012)
Lowest Rate in Last Two Years: 6.8 (September 2012)
#27 Smithfield
Latest Unemployment Rate: 8.3
Labor Force: 11,781
Employed: 10,799
Highest Rate in Last Two Years: 10.4 (August 2011, February 2012)
Lowest Rate in Last Two Years: 5.7 (June 2013)
#25 (Tie) Foster
Latest Unemployment Rate: 8.4
Labor Force: 2,701
Employed: 2,475
Highest Rate in Last Two Years: 13.4 (February 2012)
Lowest Rate in Last Two Years: 7.9 (June 2012)
#25 (Tie) N. Smithfield
Latest Unemployment Rate: 8.4
Labor Force: 3,014
Employed: 2,818
Highest Rate in Last Two Years: 9.8 (August 2012)
Lowest Rate in Last Two Years: 7.4 (December 2012)
#23 (Tie) Coventry
Latest Unemployment Rate: 8.6
Labor Force: 20,279
Employed: 18,537
Highest Rate in Last Two Years: 11.1 (August 2011, February 2012)
Lowest Rate in Last Two Years: 7.1 (June 2013)
#23 (Tie) Cumberland
Latest Unemployment Rate: 8.6
Labor Force: 19,055
Employed: 17,422
Highest Rate in Last Two Years: 10.4 (August 2011, July 2012)
Lowest Rate in Last Two Years: 7.4 (June 2013)
#20 (Tie) Newport
Latest Unemployment Rate: 8.7
Labor Force: 12,885
Employed: 11,763
Highest Rate in Last Two Years: 14.1 (January 2012)
Lowest Rate in Last Two Years: 7.2 (September 2012)
#20 (Tie) Warwick
Latest Unemployment Rate: 8.7
Labor Force: 46,308
Employed: 42,297
Highest Rate in Last Two Years: 9.5 (February 2012)
Lowest Rate in Last Two Years: 10.4 (August 2011)
#20 (Tie) West Greenwich
Latest Unemployment Rate: 8.7
Labor Force: 3,678
Employed: 3,359
Highest Rate in Last Two Years: 11.7 (February 2012)
Lowest Rate in Last Two Years: 6.6 (June 2013)
#19 East Greenwich
Latest Unemployment Rate: 8.9
Labor Force: 6,784
Employed: 6,178
Highest Rate in Last Two Years: 11.0 (February 2012)
Lowest Rate in Last Two Years: 7.5 (June 2013)
#15 (Tie) Charlestown
Latest Unemployment Rate: 9.0
Labor Force: 4,506
Employed: 4,099
Highest Rate in Last Two Years: 14.2 (January 2012)
Lowest Rate in Last Two Years: 7.1 (June 2013)
#15 (Tie) Lincoln
Latest Unemployment Rate: 9.0
Labor Force: 11,781
Employed: 10,717
Highest Rate in Last Two Years: 10.4 (February 2012)
Lowest Rate in Last Two Years: 7.9 (November 2012, June 2013)
#15 (Tie) South Kingstown
Latest Unemployment Rate: 9.0
Labor Force: 16,455
Employed: 14,982
Highest Rate in Last Two Years: 10.6 (January 2012)
Lowest Rate in Last Two Years: 7.8 (September 2012)
#15 (Tie) Warren
Latest Unemployment Rate: 9.0
Labor Force: 5,908
Employed: 5,377
Highest Rate in Last Two Years: 12.0 (February 2012)
Lowest Rate in Last Two Years: 7.6 (June 2013)
#14 Exeter
Latest Unemployment Rate: 9.2
Labor Force: 3,865
Employed: 3,509
Highest Rate in Last Two Years: 11.7 (March 2012)
Lowest Rate in Last Two Years: 7.6 (September 2011)
#13 Tiverton
Latest Unemployment Rate: 9.3
Labor Force: 8,882
Employed: 8,058
Highest Rate in Last Two Years: 12.0 (January, February 2012)
Lowest Rate in Last Two Years: 7.4 (June 2013)
#10 (Tie) Cranston
Latest Unemployment Rate: 9.5
Labor Force: 41,657
Employed: 37,682
Highest Rate in Last Two Years: 11.3 (July 2012)
Lowest Rate in Last Two Years: 8.8 (April 2013)
#10 (Tie) East Providence
Latest Unemployment Rate: 9.5
Labor Force: 24,677
Employed: 22,339
Highest Rate in Last Two Years: 12.6 (January, February 2012)
Lowest Rate in Last Two Years: 8.7 (June 2013)
#10 (Tie) West Warwick
Latest Unemployment Rate: 9.5
Labor Force: 16,240
Employed: 14,693
Highest Rate in Last Two Years: 12.9 (February 2012)
Lowest Rate in Last Two Years: 8.4 (June 2013)
#8 (Tie) Hopkinton
Latest Unemployment Rate: 9.8
Labor Force: 4,888
Employed: 4,411
Highest Rate in Last Two Years: 11.2 (February 2012)
Lowest Rate in Last Two Years: 6.6 (June 2012)
#8 (Tie) North Providence
Latest Unemployment Rate: 9.8
Labor Force: 18,130
Employed: 16,347
Highest Rate in Last Two Years: 11.3 (August 2011)
Lowest Rate in Last Two Years: 8.5 (April 2013)
#7 Burrillville
Latest Unemployment Rate: 10.0
Labor Force: 9,526
Employed: 8,570
Highest Rate in Last Two Years: 11.6 (February 2012)
Lowest Rate in Last Two Years: 8.0 (June 2013)
#6 Scituate
Latest Unemployment Rate: 10.4
Labor Force: 6,166
Employed: 5,527
Highest Rate in Last Two Years: 11.2 (July 2012)
Lowest Rate in Last Two Years: 8.4 (June 2013)
#5 Johnston
Latest Unemployment Rate: 10.5
Labor Force: 15,645
Employed: 14,004
Highest Rate in Last Two Years: 12.9 (February 2012)
Lowest Rate in Last Two Years: 9.2 (June 2013)
#4 Pawtucket
Latest Unemployment Rate: 11.1
Labor Force: 36,412
Employed: 32,378
Highest Rate in Last Two Years: 13.7 (July 2012)
Lowest Rate in Last Two Years: 10.2 (June 2013)
#3 Woonsocket
Latest Unemployment Rate: 11.2
Labor Force: 20,730
Employed: 18,409
Highest Rate in Last Two Years: 13.6 (January 2012)
Lowest Rate in Last Two Years: 10.7 (June 2013)
#2 Providence
Latest Unemployment Rate: 11.5
Labor Force: 80,605
Employed: 71,362
Highest Rate in Last Two Years: 14.3 (August 2011)
Lowest Rate in Last Two Years: 10.4 (May 2013)
#1 Central Falls
Latest Unemployment Rate: 12.1
Labor Force: 8,348
Employed: 7,341
Highest Rate in Last Two Years: 15.3 (January, February 2012)
Lowest Rate in Last Two Years: 11.4 (April 2013)


